




Most event teams assume a core of loyal attendees comes back year after year, and that the job of marketing is to fill in around them. That assumption is rarely checked against the registration list. In this Event Data Lab report, we matched attendees across consecutive editions of the same event to measure how much of an audience actually returns, and what predicts whether someone comes back.
Executive Summary
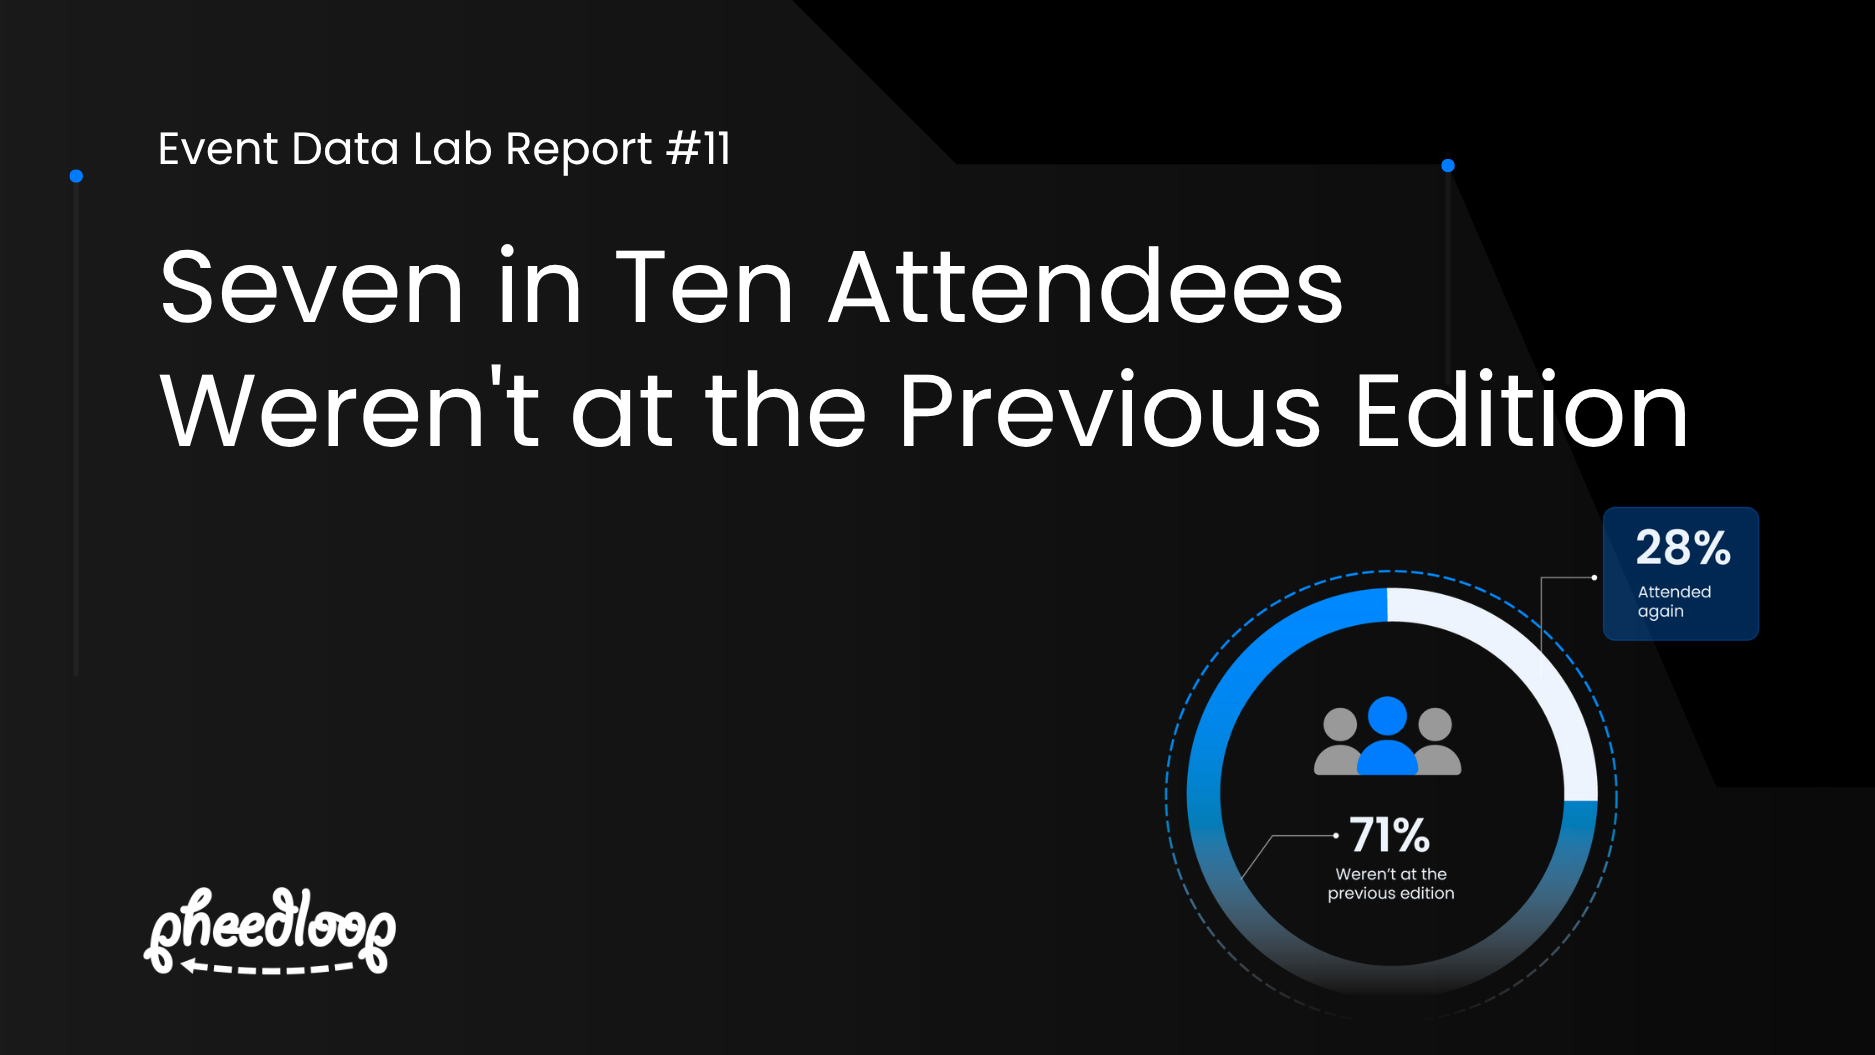
- Across 556 consecutive edition pairs, a median 71% of the attendees at any given edition were not at the previous one. Only 28% of the people at one edition were at the next, and that figure barely moves by event size, year, or cadence.
- Returning is habit-forming. Among people attending for a second consecutive year, 51% came back for a third. Among first-timers, 23% came back at all. That gap holds in every three-edition chain we examined.
- Audience retention is a first-timer problem. The event that converts a new attendee into a second visit roughly doubles the odds of a third, and that is where the leverage sits.
Dataset Overview
Dataset overview
- 556 consecutive edition pairs across 260 organizations
- 330,000+ attendees at the prior edition of each pair
- 194 three-edition chains across 120 organizations
- Both editions in every pair had 100+ completed registrations
- Editions dated January 2023 to October 2026
- Test, sandbox, and internal events were excluded; cancelled registrations and add-on purchases were removed
- Returning attendees are matched on email address, so the return rates below are lower bounds
- Data aggregated and anonymized across live events
What the Data Shows
Most of the audience is new every year
For the median edition pair, 28% of the people at the earlier edition attended the later one (interquartile range 21% to 38%). Read from the other direction, 71% of the later edition's attendees were not at the earlier one. Fewer than one pair in ten retained more than half its audience.
This number is unusually stable. By prior-edition size, the median return rate is 28% for events of 100 to 250 registrations, 28% for 251 to 500, 30% for 501 to 1,000, and 30% above 1,000. By year, it is 27% for editions held in 2024, 28% in 2025, and 29% in 2026. Events on a roughly annual cycle (330 to 400 days apart) retain 30%; events on other cadences retain 23%.
The low end of the distribution is structural rather than broken. The pairs with return rates under 5% are cohort programs, multi-city series, and other formats where the audience is designed to be different each time.
Returning once predicts returning again
Where we had three consecutive editions of the same event, we split the middle edition's audience into people who had also been at the first edition and people who were new. Then we checked who came to the third.
- Second-time attendees: 51% returned for a third edition (IQR 44% to 59%)
- First-time attendees: 23% returned (IQR 17% to 29%)
The second-timers returned at a higher rate in every one of the 194 chains, by a median factor of 2.1. Across three editions, 14% of the original audience attended all three, and only 7% skipped the middle edition and came back for the third. Skipping a year is rare; once someone misses an edition, they mostly do not return.
Membership and attendance both predict return
Two secondary patterns are consistent with the main finding. Where events use both member and non-member registration categories, members returned at 37% and non-members at 18%, and members returned at the higher rate in 92% of those events. Where the prior edition used check-in, attendees who actually showed up returned at 31%, against 20% for people who registered but did not check in.
Key insight: Attendance loyalty is built at the second visit, not the first. An event retains about a quarter of first-timers and about half of everyone else.
Practical Implications for Event Teams
- Budget for turnover as the baseline. If seven in ten seats will be filled by people who were not there last year, acquisition is the main event, not the top-up.
- Treat first-timers as a distinct audience with a distinct goal: the second visit. Post-event communication, early-bird pricing, and membership offers aimed specifically at first-year attendees are working on the group with the most headroom.
- Measure return rate every year, from your own registration list. It is one join between two spreadsheets, and it tells you more about audience health than total registrations do.
- Do not read a 28% return rate as a failure. It is the norm across hundreds of recurring events, and the events that beat it do so by a few points, not by multiples.
Download the Full Report
Get the complete dataset, extended benchmarks by event size, cadence and registration category, the three-edition analysis, and detailed methodology notes.
This report is part of the Event Data Lab, an ongoing research initiative analyzing real-world event performance across registration, onsite operations, engagement, and ROI.