.png)
When event teams design registration, adding categories (such as "Attendee," "Speaker," "Exhibitor," or "Student") is often seen as adding complexity. More paths through the flow means more decisions for registrants.
In this Event Data Lab report, we analyzed aggregated registration data across 3,600+ live events to examine how the number of registration categories relates to completion rates, and whether categories interact with ticket count in ways that affect performance.
Executive Summary
- Registration category count alone shows no meaningful negative relationship with completion rates. Events with 4-5 categories achieve a ~91% median, comparable to single-category events at ~93%.
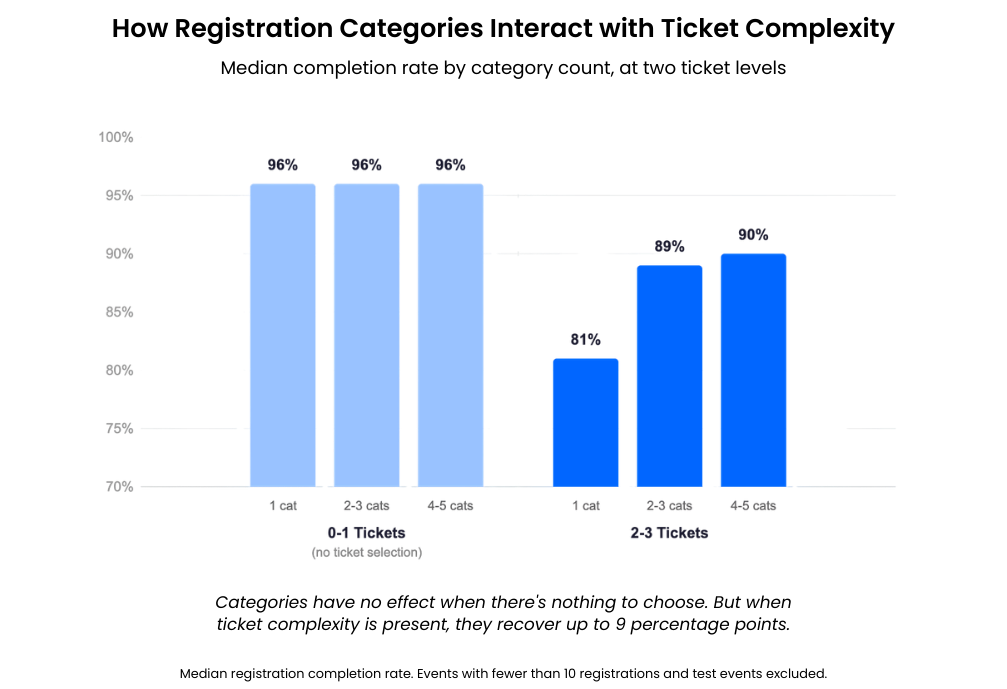
- When ticket selection is absent (0-1 tickets), completion rates are uniformly high (~96%) regardless of how many categories an event offers.
- When ticket complexity is present, events with more categories show materially higher completion. At 2-3 ticket types, single-category events complete at ~81% while events with 4-5 categories complete at ~90%, a 9 percentage point difference.
Dataset Overview
Dataset overview
- 3,600+ live events analyzed
- Same dataset used in Reports #01 and #02
- Registration categories range from 1 to 11+
- Median categories per event: 3
- Test, sandbox, and internal events were excluded
- Events with very low registration volume were excluded
- Data aggregated and anonymized across live events
Metric definition
Registration completion rate is defined as the percentage of users who completed registration out of all users who initiated the registration process (completed / [completed + incomplete] registrations).
What the Data Shows
Categories Alone: No Decline
Across all events, registration completion rates show no consistent downward trend as category count increases.
Median registration completion rates by category count
- 1 category: ~93%
- 2 categories: ~89%
- 3 categories: ~86%
- 4-5 categories: ~91%
- 6-10 categories: ~87%
- 11+ categories: ~92%
The pattern is noisy rather than directional. The dip at 2-3 categories and the recovery at 4-5 suggest that category count is confounded with other event characteristics, rather than driving completion independently.
The Real Test: Categories When Ticket Complexity Is Present
Report #02 established that ticket count is the strongest observable predictor of registration completion. The more important question is whether categories interact with ticket count.
When events have no meaningful ticket selection (0-1 tickets), completion rates are uniformly high regardless of categories:
- 1 category, 0-1 tickets: ~96%
- 2-3 categories, 0-1 tickets: ~96%
- 4-5 categories, 0-1 tickets: ~96%
No effect. Categories add no friction when there's nothing to choose.
But when ticket complexity is present, the story changes. Among events with 2-3 ticket types:
- 1 category: ~81% median
- 2-3 categories: ~89% median
- 4-5 categories: ~90% median
That's a 9 percentage point recovery. Events that distribute 2-3 tickets across multiple categories show completion rates that are nearly as high as events with no ticket selection at all.
The most likely explanation: when tickets are organized within categories, registrants see only the tickets relevant to their path, not the full menu. Categories act as a filter, reducing the perceived number of choices at the decision point.
This buffering effect is most pronounced at moderate ticket counts (2-5 tickets). At very high ticket counts (6+), even well-structured categories show limited ability to offset the impact of choice complexity.
Key insight: Registration categories do not add friction to the registration flow. When combined with ticket selection, categories appear to reduce friction by narrowing the choices a registrant sees at the decision point. Event teams should consider structuring tickets within categories rather than presenting all options in a single view.
Practical Implications for Event Teams
- Adding registration categories does not reduce completion rates. Teams that need multiple attendee paths should not hesitate to create them.
- For events with multiple ticket types, distributing tickets across categories is associated with materially higher completion. This is the most actionable finding in this report.
- The buffering effect is strongest at moderate ticket counts (2-5 tickets). Events with very high ticket complexity (6+) should consider reducing the total number of options in addition to organizing them.
- Teams following up on Report #02's finding that ticket count reduces completion now have a concrete mitigation strategy: use categories to reduce the visible choice set for each registrant.
Download the Full Report
Download the full Event Data Lab report
Get the complete dataset, the full interaction matrix between categories and tickets, and detailed methodology notes.
This report is part of the Event Data Lab, an ongoing research initiative analyzing real-world event performance across registration, onsite operations, engagement, and ROI.